|
The ACD Q & A
Below you’ll find
descriptions of Logical Trader’s ACD Daily reports; click on the
links for illustrations of exactly what the report looks like.
Immediately below are the most frequently asked questions from new
ACD subscribers. For even more comprehensive insight to ACD, visit
the Glossary section!
Commodity
Pivot Tracker
A trading tool that assists in forecasting an increase in
short-term market volatility.
Commodity/Stock
#Line Sheet
The "fitness test" of a market. Provides a numerical
analysis of the past 30 trading days to determine it's overall
health (strength or weakness).
ACD
Methodology - Triangle Sheets
Presents a visual "ACD" picture that assists the trader
in establishing a macro and micro bias with well-defined points of
reference.
Commodity/Stock
Pivot Sheets
Includes vital information such as high, low, close and pivot
ranges.
Stocks
Change In Trend
Proprietary program highlighting high probability "change in
trend" dates for the current calendar month. Based on 15
years of historical data, it helps identify changes in both macro
and micro trends.
Commodity
'A' and 'C' Values
Lists the 'A' and 'C' values, as well as the length of the opening
range for each commodity.
Energy
Market Commentary
A logical approach to today's energy trading based on a summary of
prior market activity.
Commodities-First
Trading Day Of The Month
Highlights the high, low, close and pivot range from the first
open outcry session of the month. This first trading session
establishes a macro bias as well as a point of reference to be
used during the remainder of the month.
Natural
Gas And Crude Oil Spread Sheets
A scorecard for the intraday movement of the first eight spreads.
Coffee,
Sugar, Cotton and Cocoa Spread Sheets
A scorecard for the intraday movement of the first eight spreads.
Commodities
And Stocks - First Two Weeks Of The Year
Very similar to the First Trading Day Of The Month item (see
above). This ACD tool uses the high, low, close of the first two
weeks of the year as well as the high, low, close of the first two
weeks of July to establish pivot trading ranges for both the first
and second halves of the year. These two-week pivot ranges provide
the trader with early insight into future market direction for
both stocks and commodities.
Most commonly
asked questions:
Q. Can the “ACD Method” be applied to
stock or commodity xyz?
A. As long as there is sufficient liquidity
and sufficient volatility “ACD” can be applied to virtually
any stock or commodity.
Q. How can I get the A-C value for
a stock that is not listed in the ACD stock reports?
A. A good approximation of the current “a” value for any stock
would be to take the 30 day avg. range (h-l) and use 20-25% of
this value.
Q. What prices are used in
calculating the pivot range?
A. A pivot range is based upon the high,, low and close of a
specific trading period. (for day traders, this would be the
previous trading day.)
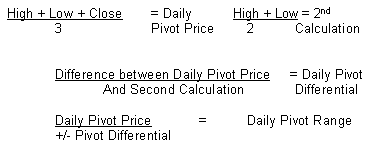
Q. How is the pivot range
calculated?
A. Calculate the daily pivot
range using the following formula:

Q. What is
the significance of the Number Line Sheet?
A. The main purpose of the number line is to identify a
potentially developing trend. When the 30 trading day cumulative
tally goes from a base of 0 to reach +/- 9 on two consecutive
trading days, it becomes significant.
Q. Can I
create a “pivot moving average” indicator in my charting
software?
A. Although, all charting software packages are different, almost
all come with the capability to plot moving averages. The problem
arises in that the default in most packages creates moving
averages based on “closing” prices.
The “pivot moving average” is calculated using the pivot (vs.)
the closing price. Therefore, if your charting software allows you
to change the price component of the moving average from close to
(h+l+c)/ 3 you will be able to plot the pivot moving average
indicator.
Q. What is a
“Pivot on Gap Day” that is referred to on some of the ACD
information sheets?
A. When the market gaps open, above or below the daily pivot range
and never trades into the daily pivot range from that day, a Pivot
on Gap Day has been established. That Pivot on Gap Day becomes
critical support or resistance for future trading sessions.
Q. What is a
sushi roll?
A. In the ACD system, sushi roll is the name given to a particular
early-warning indicator of a change in market direction. The sushi
roll utilizes five (5) rolling trading days (or for a shorter-term
perspective, five 10-minute bars). The sushi roll compares the
latest five increments of time to the prior five increments of
time to determine if the market is changing direction.
Q. What
should I do if “this” or “that” scenario occurs?
A. Regardless of the scenario, the answer always remains the same:
The ACD methodology should be adapted to suit your own trading
styles and parameters. Therefore, it should be incorporated into
your trading to help you plan out and execute your trading
strategies.
For example, where Trader 1 may be trading breakouts, Trader 2 may
be better suited fading failed breakouts. Obviously their entry
and exits would be quite different. However, neither would be
“wrong”.
The
following 5 ACD rules should greatly improve your trading:
1.
Plot point A’s and C’s as points of reference.
2.
Lean against these reference points as you execute your trades.
3.
Maximize your size when the trading scenario is favorable. At all
times, minimize your risk.
4.
Know where you are getting out if you’re wrong.
5.
If you can answer 4, you will trade with confidence.
|

